
Caustic
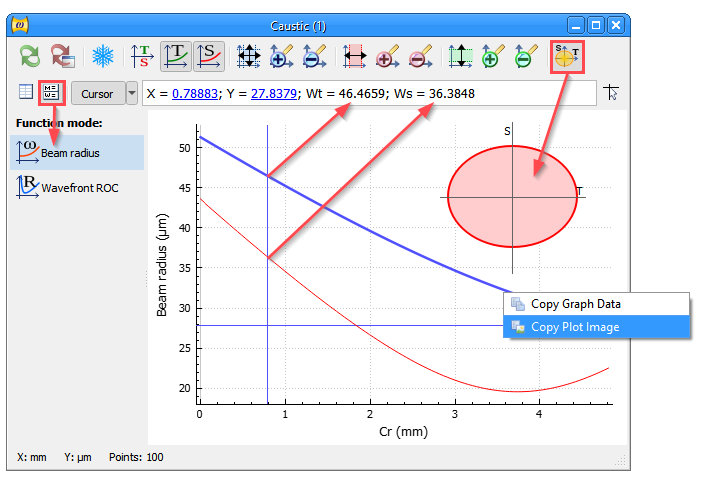
The function plots beam radius and wavefront curvature radius along specified element. Use the function options panel at the left for switching between Beam size and ROC calculations modes ().
Use the data table () or highlight a graph and select the context menu command for exporting calculation results via Clipboard as text. Use the context menu command for exporting picture.
The function can schematically render beam cross section to visualize astigmatism. Use the button on the window toolbar or the menu command.
Function Parameters
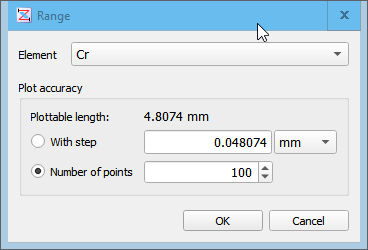
Element
The selector allows to specify an element along which caustic should be plotted. Only elements having the length parameter can be selected. These are empty ranges, crystals, etc. The length parameter usually called L.
Plot accuracy
Fields allow to set a number of points in the resulting graph. Points number can be input directly in the “Number of points” field. Instead, it is possible to specify a distance between points (plotting step) in the field “With step”.
The “Plottable length” value in the dialog shows the longest geometrical path a beam can travel in the element. This becomes a plot’s horizontal range. For some elements (e.g. Brewster Plane-parallel Plate) the plottable length is greater than the element length because there is an angle between optical axis and the direction the length is measured along.
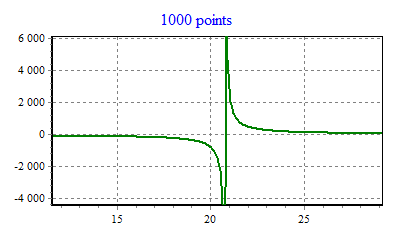
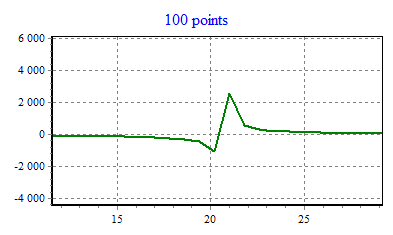
If there is a waist inside the element, the graph of beam radius usually requires less points than the wavefront curvature graph, to be accurate. Is is due to wavefront curvature radius changes quickly in the near-field zone and can not be approximated with a few points as it can be in the far-field zone.
See also
Function Freezing, Round-trip for Plot, func_caustic_mr, func_caustic_mb