How to get more significant figures on plot axes
This tutorial is for reZonator of version 1.
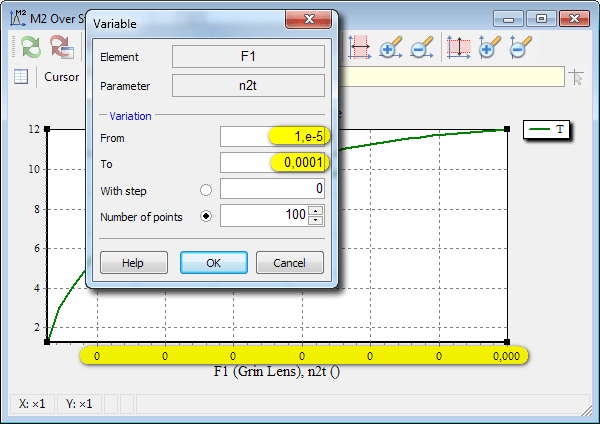
When you try to plot something against small values of variable, default format settings of axis labels can prevent you from seeing actual values of the variable:

To avoid this, you have to specify your format of axis labels instead of the default one.
Right-click over the axis and select the 'Format' command:

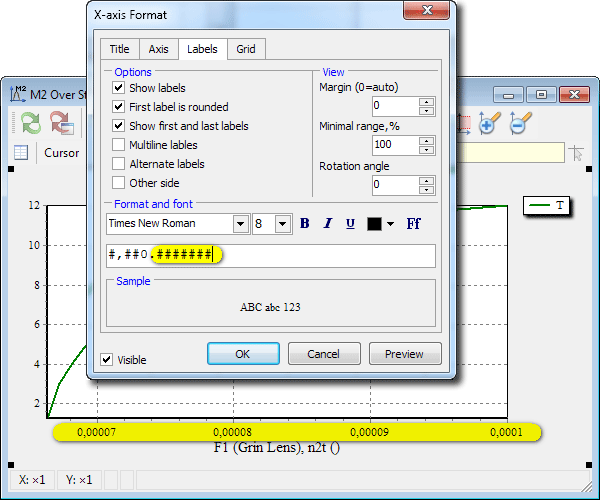
In the 'Axis Format' dialog, navigate to the 'Labels' tab, and locate the labels format input field.
Type as many #-signs after the decimal point as many decimal digits you want to see:

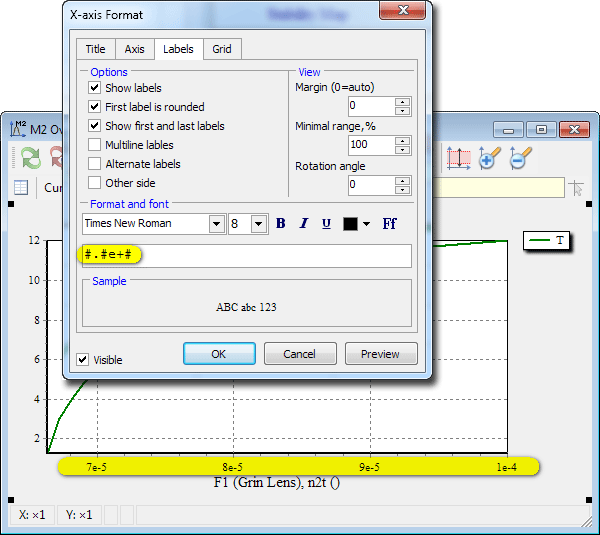
You also can use the scientific notation of axis labels to display small values.:
